SensorMetrics
A platform that collects data from sensors (temperature, humidity, CO₂, power…) and turns it into dashboards tailored to each user.
- Role
- Author — design, development, operation
- Period
- 2026 – dnes
- Technologies
- PHP 8.4, Symfony 7.4, MySQL / MariaDB, Twig, Chart.js, GridStack, Deployer
- Languages
- SK
- Status
- In production
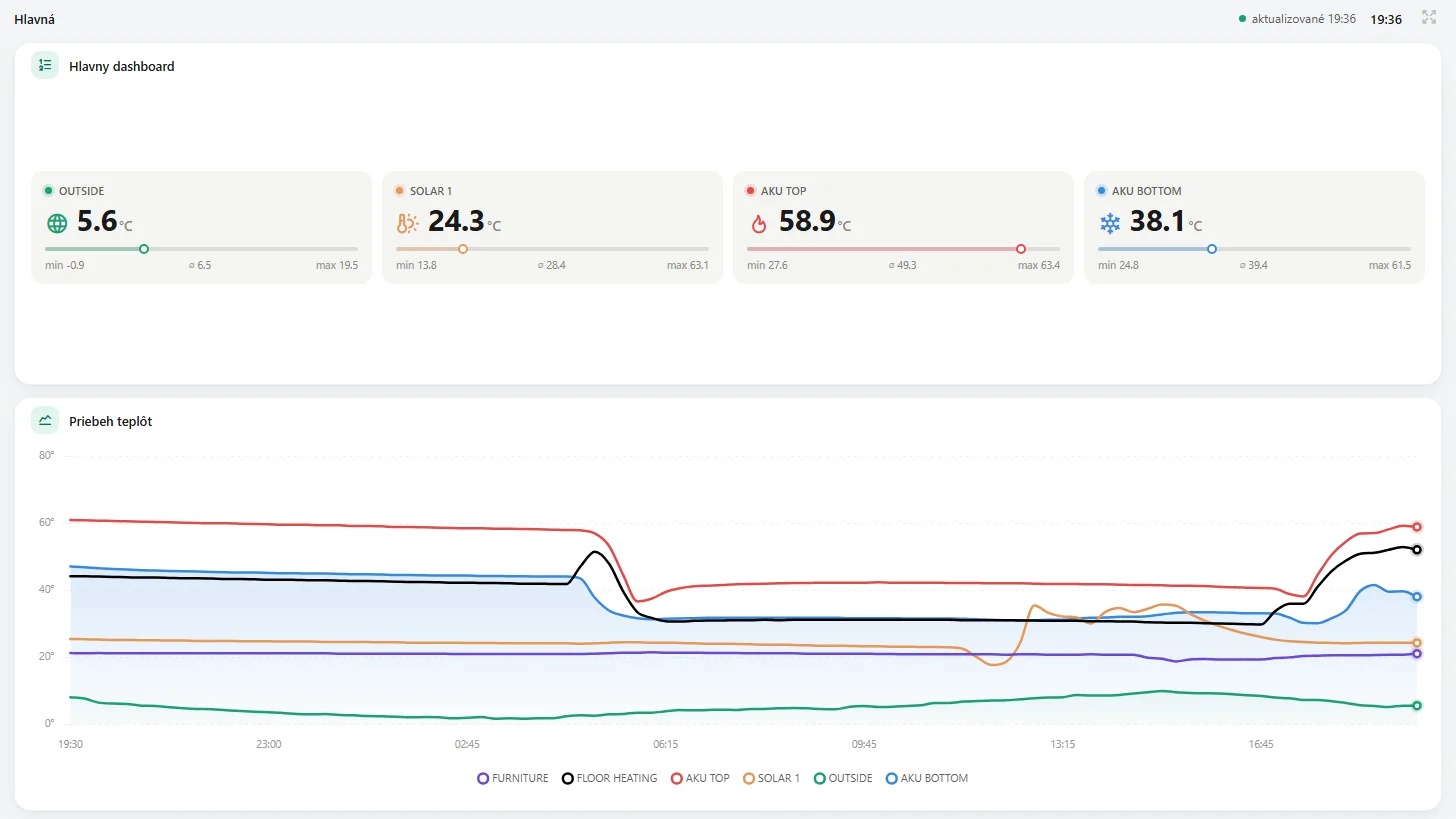
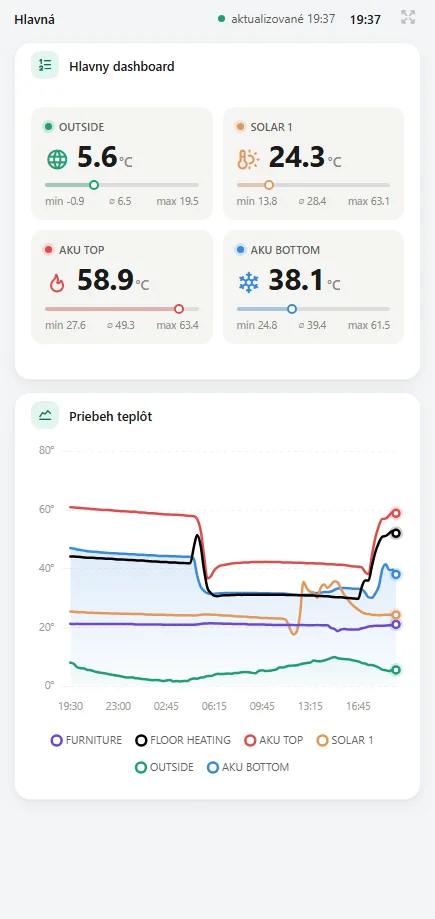
What the application does
Widget dashboards
Chart, statistics, table and gauge. Widgets can be dragged and resized, with any number of pages.
Minimums and maximums
Extreme values and the average for an hour, day, week or month.
Metric management
Type, unit, icon and colour of each metric, online/offline status and manually added records.
Public view for TVs
A read-only dashboard at its own address or subdomain, with no login.
Technical solutions
Ingesting data even from devices without HTTPS
Microcontrollers such as the NodeMCU can't do HTTPS, so writes are protected by an API key of which only a SHA-256 hash is stored. An optional HMAC signature adds a timestamp and replay protection. The key is write-only — it can neither log in nor read data — and writes are throttled by a rate limiter.
Graf
The chart resolution follows the selected period — minutes, 15-minute, hourly and daily averages — so a monthly chart stays fast even with hundreds of thousands of readings. A metric with no reading for over 15 minutes is marked offline.
Multi-user without an ORM
Database access goes through a custom PDO wrapper and SQL migrations, without Doctrine. Every metric belongs to a single user and every query filters by it, so another user's data can't be loaded even through an ID in a widget. Sign-up has email verification, a honeypot and Cloudflare Turnstile.
Public dashboards on a subdomain
A page can be published at /v/slug or on its own subdomain through wildcard DNS. The public view runs without a session, returns noindex and no-store headers, and on such a host nothing exists besides the dashboard itself.